Guide Objectives
- Understand why citizen-reported “lived experience” data is a missing layer in most heat response systems and why it’s important to fill this gap
- Learn a replicable methodology for rapid household-level data collection during heat events that can be adapted for other climate and disaster contexts
- Use citizen-reported data for energy demand management strategies
- Identify pathways for embedding this data into routine planning systems
Cities today have access to a growing range of geospatial datasets that map heat exposure, built-up density, land surface temperature, tree cover, and more. These are valuable for identifying urban heat hotspots and spatial patterns of risk.
However, these datasets do not adequately capture the direct, lived experience of heat, or how that experience translates into energy use. What people switch on, what they ration, what they can and can’t afford to run, forms a critical “citizen experience layer” that is largely missing from public energy planning systems. Without this citizen experience layer, organisations may be able to identify where heat exposure is highest, but not how households are adapting, which services are under the greatest pressure, or where targeted interventions are likely to have the greatest impact.
To plan for energy demand during extreme heat, agencies need a rapid data collection methodology that can be embedded within departments, one that captures time-sensitive information during heatwaves, rather than relying solely on long-term or indirect indicators.
Guide Use Case
Consider a utility or energy department that already has a seasonal load forecast based on historical consumption. That model tells them demand will rise in summer, but not which neighbourhoods will see the sharpest spikes, which load types are driving it, or which households are cutting back on essential appliances rather than running them. A rapid citizen survey, layered onto the existing heat and load data, closes that gap within a single season.
Understand How Heat Reshapes Energy Demand
Heat doesn’t just increase electricity use; it changes what people use energy for and who can afford to use it. Field evidence from rapid surveys shows a few patterns: Cooling load (AC and fans) rises sharply, but usage is significantly higher and lasts longer among households that can afford it. This reveals clear inequalities in adaptive capacity while non-cooling loads tied to heat also shift: refrigeration runs harder and longer, water pumping increases (for drinking, cooling, or irrigation), and commercial/industrial processes often draw more power to manage heat-sensitive operations. Additionally, productivity and behaviour demand changes too, such as shifted work hours, altered appliance schedules, or rationing during peak-tariff hours.
Real-time insight into all of these consumption patterns, not cooling alone, helps utilities and government agencies:
- Anticipate spikes and shifts in electricity demand during extreme heat events
- Reduce the risk of grid stress and outages
- Inform targeted advisories and demand-side management measures during periods of peak consumption
Together, rapid data on heat exposure, citizen experience, and the full range of heat-linked energy demand creates a strong evidence base for both short-term response planning and longer-term policy interventions.
Design and Run a Rapid Data Collection Exercise
The objective is not to build a large-scale household dataset, but to generate timely evidence that can inform operational decisions while a heat event is still unfolding. A rapid methodology combining citizen-reported outcomes with spatial analysis of heat exposure, generating actionable insights during peak heat season rather than months later.
Geographic Targeting
Select households using a that maximises variation across neighbourhoods. Distribute the sample across administrative or electoral units (e.g., wards, polling booths, constituencies) to ensure representation across different urban forms and socioeconomic conditions. Sample size and unit count should be scaled to the city’s population or any relevant benchmark using appropriate weights.
Survey Design and Data Collection
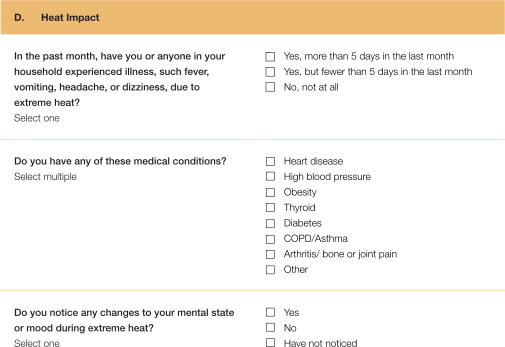
Collect primary data through short, structured, in-person household surveys (typically 10–20 minutes), timed to peak heat season. Keep the survey focused on a small set of key indicators to ensure that data collection remains feasible during active heat events and reduces respondent burden. Some recommended set of indicators:
- Self-reported heat-related health symptoms
- Disruptions to work and daily activities
- Energy-relevant coping strategies; cooling (AC, fans), refrigeration, water use/pumping, and any other appliance or behaviour shifts during heat
- Household electricity consumption patterns, bill data and changes during heat periods, broken down by load type where possible
Statistical and Spatial Analysis
Combine survey responses with available geospatial datasets such as built-up area, vegetation/tree cover and temperature/humidity layers by overlaying them within a GIS platform. Using the latitude and longitude collected for each household during the survey itself, map survey responses onto these spatial layers and assign each household the corresponding environmental and urban form characteristics of its location. This enables aggregation and analysis at the neighbourhood level, allowing agencies to move beyond simple exposure mapping toward identifying patterns in health impacts, productivity loss, and energy demand across different microclimates.
Guide Use Case
Building on this, the department designs a short, in-person household survey during peak summer, targeting a sample across different neighbourhood types. By collecting data on appliance usage, coping behaviours and electricity bills (along with household locations) they generate a rapid, ground-level dataset that captures how demand is actually changing across the city in real time. The department then overlays household responses onto heat and urban form maps to identify which neighbourhoods are likely to experience the highest demand spikes and which load types are driving them. This allows them to anticipate localised grid stress, rather than relying only on city-wide forecasts.
Before moving to analysis, consider:
- Does the survey capture information that existing administrative systems cannot?
- Are the selected neighbourhoods representative of different urban and socioeconomic contexts?
- Which departments or agencies will ultimately use these findings?
Integrate Findings into Energy Planning
Even a limited, rapid snapshot of electricity bills and heat-linked usage can reveal how demand rises with temperature, which load types drive it, and how usage differs across neighbourhoods and income groups. By integrating these survey results with geospatial heat exposure data and utility distribution data, you can identify neighbourhoods and load types where demand is likely to spike. With this information, you can better anticipate localised grid stress.
Rapid insight into appliance usage, peak-hour consumption and affordability constraints can support:
- Anticipation of short-term demand surges during heatwaves, broken down by load type
- Targeted demand-side management in high-risk areas
- Design of immediate support programmes for vulnerable households
Scaled appropriately, this approach helps utilities and energy planners move from reacting to demand spikes toward anticipating them using a combination of environmental exposure and citizen-reported behaviour.
Institutionalise the Approach for Government Use
Disaster management authorities, health departments, urban local bodies, and electricity distribution agencies can institutionalise this approach by embedding short, standardised citizen surveys into existing seasonal monitoring and response systems. Combined with administrative and geospatial datasets, this creates a rapid, interoperable evidence base on heat exposure (that can be used by different departments), health impacts, and energy demand.
- Disaster management authorities gain timely identification of neighbourhoods facing acute health and livelihood risk during heat events
- Health and urban agencies can design more targeted relief and public health interventions based on observed impacts
- Electricity distribution agencies can use household-level data, across cooling, refrigeration, pumping, and other load types, to inform short-term demand management and grid stress mitigation
Organisations may choose to pilot this approach in a limited geography or during a single heat season before embedding it within routine monitoring and planning systems. Embedding this process within routine operations ensures energy planning is guided by current, on-the-ground conditions rather than delayed or indirect indicators.
Guide Use Case
Over time, the department integrates this rapid survey approach into its seasonal planning cycle, repeating it each summer and linking it with existing load forecasting systems. This enables more proactive demand management, targeted advisories and better coordination with health and disaster response agencies during heat events.
‘So What’ and Next Steps
Heat-driven energy demand is broader than cooling alone, and a rapid citizen-reported data layer is what reveals the rest of it. You do not need to wait until comprehensive monitoring systems are in place, although that is the aspiration. A small pilot can generate valuable insights, strengthen collaboration across departments, and build the evidence needed to scale this approach over time. Cities that build this capacity once can reuse it every heat season, expanding the range of load types you track and refining the survey instrument as institutional ownership grows, rather than starting from scratch each year.
About this Guide
This Guide builds on implementation experience and lessons from Survey Mapping Heat Inequality Across Neighbourhoods in Delhi, a working paper developed by Artha Global with support from data.org. This Guide distils practical approaches that governments, utilities, and other practitioners can adapt to strengthen heat preparedness and energy planning in their own contexts.
Stratification is a sampling design that divides the target population into subgroups before randomisation, ensuring that key subgroups are represented in the final sample. In addi addition to improving representativeness, stratification enables disaggregation of results during analysis. (World Bank DIME Wiki Sampling)
Was this guide helpful? Please rate this guide and share any additional feedback on how we might improve it.