
Guide Objectives
-
Visualize your data architecture
-
Understand the fit criteria for data tools
-
Identify challenges with your current data tools
-
Determine the source of the challenges
Social impact organizations (SIOs) are increasingly relying on data-driven tools to organize their work and achieve their mission.
However, in many cases these data tools are not being used optimally, creating frustrations amongst staff and stakeholders. When this occurs, the first thought is often to change tools. This guide is created to push back against that notion.
The reality is the best tool is not necessarily one with the greatest functionality, the best user interface, or the highest customer ratings. The best tool is the one that fits your organization’s needs.
This guide is designed to provide a framework for assessing whether your current data tools are meeting your organizational needs. And, whether the key challenges are based on the tools themselves or the staff’s use of them.
Guide Specific Disclaimer
An SIO’s data architecture may be more or less complex depending on data needs and the organization’s size, structure, and service lines. Depending on the number of data tools your organization uses, completing the steps in this guide may require insights from colleagues in other functions or departments.
Regardless of the size of your data architecture, we recommend starting with the tools you know in order to learn the assessment process.
Classify your current data tools by their function
An organization’s ‘data architecture’ consists of the tools that enable the flow of data through the organization. Every organization has a data architecture, no matter how complex or simple.
In our experience, to understand whether a data tool fits your needs, you must first take a step back to visualize your overarching data architecture. By doing so you will have a better understanding of how these tools are connected to one another.
In this first step, you will document your data architecture (i.e. the ensemble of your data tools) using a simple template we have created. You can see more detailed instructions on how to do this in the ‘Read First’ tab of the template, and in the video tutorial.
Useful terms when creating your Data Architecture
Data Architecture: Data architecture describes how data is managed–from collection to transformation, distribution, and consumption. It sets the blueprint for data and the way it flows through data storage systems.
Data :
- Data Entry & Collection: Tools that facilitate both the gathering and entry of data. Examples include: Word, Excel, Google Forms, Survey Monkey, etc.)
- Data Storage: Tools that store collected data. These tools may have the ability to transform data for analytical or operational needs. Examples include: Google Drive, Microsoft 365, Salesforce, MySQL, Quickbooks, etc.
- Data Analysis & Visualization: Tools that analyze data to derive insights and, potentially, present these insights visually. Examples include: Tableau, Power BI, Excel, Google Sheets, etc.
Document tool management attributes and relationships
After placing each tool in its appropriate column within the Data Architecture tab, there are two key attributes of each tool to document:
- the level of management required to maintain the tool
- the tools’ interoperability with downstream tools within the process.
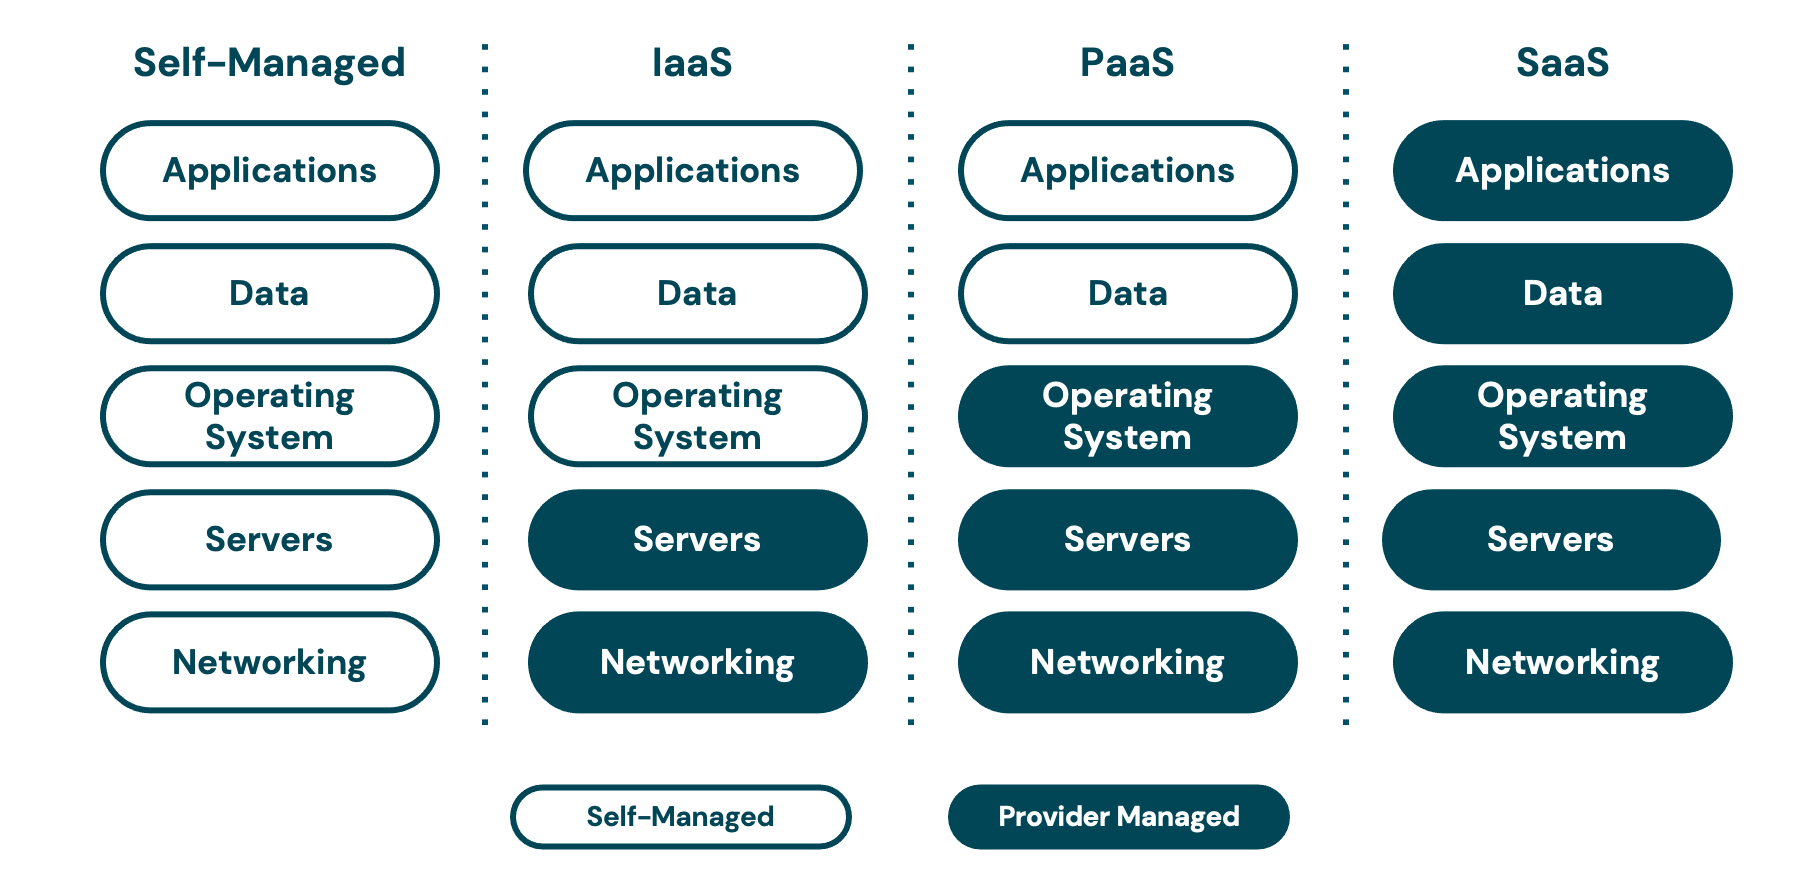
For the level of management, the options include: self-managed, Infrastructure as a Service (IaaS), Platform as a Service (PaaS), and Software as a Service (SaaS). For tool interoperability, the focus is on automated or manual, which is essentially to indicate the level of human involvement needed to move from one column within the data architecture to the next.
Check out these definitions for a deeper understanding of these terms.
Types of Data Tool Management Levels
- Self-managed: This model, often associated with the term on-premise or “on-prem”, refers to private data centers that companies maintain themselves, usually within their own spaces. This type of infrastructure can be used to run private clouds, where resources are virtualized similar to those of public clouds.
- IaaS (Infrastructure as a Service): This is when a third-party provider hosts servers, storage, and other virtualized computer resources and makes them available to customers over the internet. Examples include Amazon Web Services or Microsoft Azure Virtual Machines.
- PaaS (Platform as a Service): This is when a third-party provider hosts application development platforms and tools on its own infrastructure and makes them available to customers over the Internet. Examples include Google App Engine and Microsoft Azure.
- SaaS (Software as a Service): This is a software distribution model where a third-party provider hosts applications and makes them available to customers over the Internet. Examples include Google Sheets, Calendly, Microsoft Forms, etc.
Types of Interoperability:
- Automated Connection: When two tools or applications are interoperable (i.e., they can talk to each other), without any human intervention in doing so
- Manual Connection: When two tools or applications require human intervention to talk to each other (i.e. you transfer the information)
Assess each tool based on the fit criteria
Once you have entered your tools into the Data Architecture tab, you are now ready to move on to the Fit Assessment Tab. During this step, you will assess each tool individually based on a series of fit criteria.
The fit criteria are here to help you dive deeper into determining what is, and isn’t, working for each tool. This level of detail is important in determining the appropriate next steps for ensuring your data tools are the best fit possible for your organization.
Remember, depending on the complexity and size of the organization, the fit assessments could be handled by one person, by a committee, by surveys to a large group, or a number of other ways. For simplicity, we have focused on the assessment itself and how the process flows for one person, acknowledging each organization may handle this in different ways.
Data Tool Fit Criteria
People: Is the tool being used consistently by the team? Do they find this tool useful and practical?
Skills: Are the skills necessary to use this tool present in the team and/or easy to develop/hire in the future?
Cost: Is the cost of the tool reasonable for the functionality and ease of use, and can it be managed over time?
Security: Does the tool adequately protect your data from human error and intentional misuse?
Functionality: Does the tool adequately perform its intended function and make carrying out tasks easier?
Interoperability: Can the tool connect with other systems in a way that meets your organization’s needs (automated or manual)?
Scalability: Can the tool scale with the organization in terms of functionality and cost?
Support Services: Does the tool provider offer support services that are valuable and readily available when needed?
Identify the key challenges for each tool
Now that you have assessed your tools using the fit criteria, you can identify where your primary and secondary challenges occur. It could be the growing cost, lack of consistent team use, limited functionalities or even persistent security concerns. At this stage, details are important as they will help you articulate your concerns to your team or the tool’s support services.
Use the notes column on the Fit Assessment tab to capture these details. While doing so we encourage you to think about the source of your challenges. For example, is the source of the challenge human or technology made? Could these challenges be addressed through professional development courses rather than changing a tool?
‘So what’ and next steps
Through this guide you first mapped your data architecture to get an overview of the tools you use, and how they connect to one another. Then you assessed each one of these tools individually based on the fit criteria.
Based on your assessment, you can now lead important conversations in your organization about how you can overcome the challenges you identified. This may include training key team members on the proper use of the tool or making clearer processes that can be scaled throughout your organization.
And of course, if the challenges are linked to the technology itself, you can now use these fit criteria to select a new tool that will fit your organization’s needs.
Was this guide helpful? Please rate this guide and share any additional feedback on how we might improve it.