In October 2021, alarm bells began to sound in the offices of Citizens Advice.
An 80-year-old organization that provides free, confidential advice to assist people with legal, debt, consumer, housing, and other problems in the United Kingdom, Citizens Advice has a deep on-the-ground understanding of the most crucial issues communities are facing at any given moment.
And in the fall of 2021, it was clear that the cost of living was becoming a crisis.
“What’s unique about doing advocacy work at Citizens Advice is that we can quantify what would otherwise be qualitative because we have access to massive amounts of operational data through the services we provide,” says Head of Policy Morgan Wild.
That access allowed their data and policy teams to quickly come together to create chart-smart visualizations of exactly how people across the country were facing greater economic insecurity.
The Challenge
The prices of energy, housing, and consumer goods continued to climb throughout the fall of 2021 and those coming to Citizens Advice were making difficult decisions about what to cut back on and where to rely on community support. Citizens Advice’s data showed households increasingly seeking referrals to food banks and advice about how to pay their energy bills. These key indicators helped Citizens Advice forecast the looming crisis earlier than most other government or advocacy entities in the UK.
“Even before it kicked up in the public imagination, the warning lights in our data started flashing,” said Tom MacInnes, chief analyst.
“At first, the government didn’t realize the extent of the challenge,” added Wild. “But because we could see this coming down the tracks quite early on, the rising cost of living became a campaigning priority and we continued to push it.”
It’s hard to stay stupid about what’s going on [in the UK] when you work at Citizens Advice. You get a really good understanding of the nuts and bolts of how policy is affecting people’s lives by not only looking at trends on the type of advice people are seeking, but by listening to the stories they tell.
Morgan Wild Head of Policy Citizens Advice
By the spring of 2022, record numbers of people in the UK had entered or were facing poverty. Finally, on May 27, 2022, the UK government announced a £15 billion package to provide support to millions of households, including a discount on energy bills and a one-time cost of living payment.
“The package reflected everything we had recommended, in particular, cost of living payments of about £650 to households that qualified,” said Wild. “We were really pleased to see our policy efforts pay off and we thought, what do we need to do next?”
The next step, they realized, was tracking the effect of this package on those seeking their services. This was a central test for government policy over the coming months: could it turn these trends around?
“A good few crisis indicators in our data that would let us look at where the package was affecting people,” said Wild. “And using this data we could continue to affect policy.”

The Solution
After two sprints and several intense working days, the data and policy teams produced the organization’s first-ever cost-of-living dashboard.
“It was a really nice example of the policy and data teams bringing together quite different disciplines to be able to visualize the dashboards’ various constituent parts,” said MacInnes.
And what that dashboard revealed was stark.
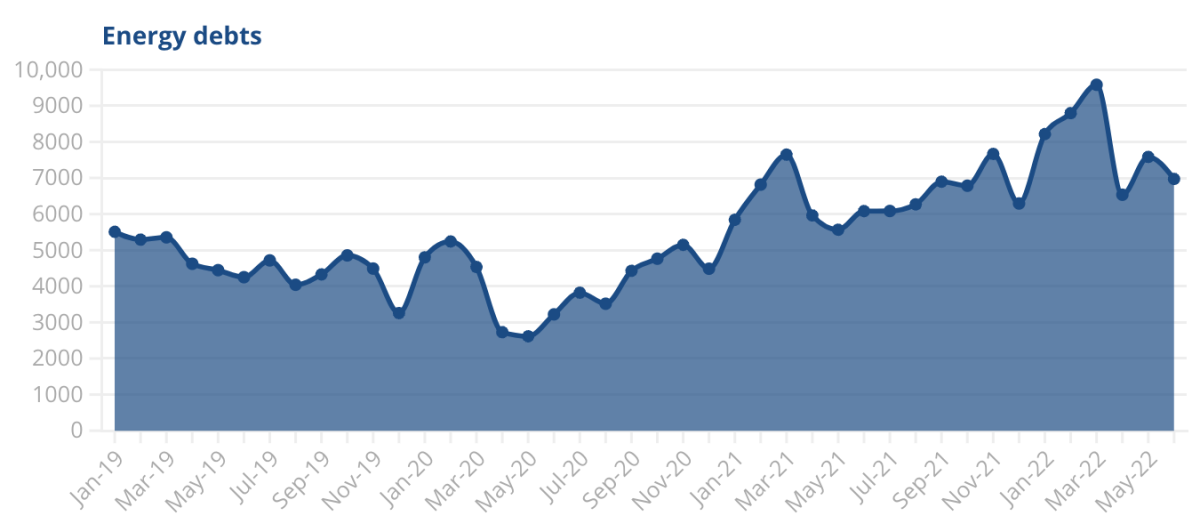
By July of 2022, Citizen Advice had helped more people with energy issues compared to any other year on record and we’re seeing more people coming to them who were facing or experiencing homelessness than ever before. But it was also clear that parts of the government package were working. There was a sharp decline in food bank referrals in July, directly after the cost of living payment was distributed.

The teams also realized that this data was only useful if the people making policy decisions had access to clear, well-displayed information.
“We worked really hard to make our stuff look as enticing as possible to catch your eye and convey information quickly,” said MacInnes. Most importantly, they made the dashboard public, something they had only begun doing during the pandemic. “We had a lot of data, but you had to ask for it. It wasn’t fully accessible, even to our own staff.”
Alongside the publication of updated, transparent data each month, Citizens Advice also began hosting large virtual events, often attended by more than 1,000 people, to discuss and dissect the trends. Attendees range from the general public to officials from local and central government offices. The shift in approach has increased not only public trust in Citizens Advice but governmental reliance on their data and insight.
“We have seen an incredible increase in requests for our data—from local civil servant analysts all the way to central government offices,” said MacInnes.
Even before it kicked up in the public imagination, the warning lights in our data started flashing. It was clear that the cost of living was becoming a crisis because of the sheer number of people coming to us.
Tom MacInnes Chief Analyst Citizens Advice
The Takeaway
It’s the currency of the public dashboard data that is allowing Citizens Advice to continue to impact policy on behalf of those they serve.
Sharing operational data in a clear, visual way helped build a case for government intervention and what’s more—provided insight into exactly what type of intervention might work. But in order to create these compelling, actionable dashboards, experts from across disciplines had to work together.
“Each time our teams work together it gets easier and better,” said Wild. “We’ve identified the right foundations for this going forward and are now in the iterative phase, taking insights from our virtual events and evolving the dashboards—dropping some things and adding in new elements here and there.”
Looking ahead, Citizens Advice is now working on an open data offering to provide dynamic, localized information to the public as an expanded service of the organization.
“Traditionally, we write a lot of policy reports at Citizens Advice with static data and graphs,” said Wild. “But the experience of the last couple of years has made us realize how valuable our data is and, even more, how important it is to show it visually and make it accessible to those who need it most.”


