Overview
Civil servants handle vast amounts of data to advocate for resources, evaluate program effectiveness, and maintain transparency across departments. However, data analysis can be a complex and time-intensive process, often requiring a review of large datasets to identify meaningful patterns and develop actionable insights. GenAI tools can improve this process by quickly uncovering trends, identifying inconsistencies, and streamlining routine analysis. This section outlines practical ways you can begin adopting GenAI into your data analysis workflow.
Applying This Tip
While GenAI can process large volumes of data quickly, it may not capture the nuanced insights and context that experienced analysts provide. It’s a good practice to have a team member review the outputs, ensuring that cultural, historical, and subjective factors are appropriately considered. To start testing a GenAI tool, use publicly available sample data found on your government’s open data portal. This allows you to explore the tool’s features without risking sensitive information.
These tips focus on GenAI tools that are designed to work with datasets that are already prepared for . This data has been cleaned and organized, as opposed to raw data, which typically contains missing values, duplicates, and errors. Techtarget’s guide to data preparation includes best practices and recommendations on how to properly prepare data for analysis.
Analyze Data
GenAI tools can assist with tasks such as preparing base budget requests, comparing current-year allocations with previous figures, and evaluating government programs. For example, you can prompt these tools to spot trends with Consumer Price Index (CPI) growth, tracking budget versus actual spending over time, as well as cost overruns, revenue trends, and other key metrics.
Below are a few commonly used GenAI tools for data analysis:
| Tool | Key Features |
|---|---|
| Qlik | Free trial available Generate insights, create visualization, and utilize predictive analytics using conversational dialogue |
| BigQuery Studio Google | Free trial available Write SQL, build predictive models, and visualize data using conversational dialogue |
| KNIME | Available for download Generate data science workflows, data visualizations and code snippets based on text prompts |
| Julius | Free trial available Interpret, analyze, and visualize complex data using conversational dialogue |
One approach to using a GenAI tool for data analysis is to upload your dataset or copy and paste sections from your dataset into a GenAI platform and ask specific questions to uncover trends, outliers, and key insights. GenAI tools made specifically for data analysis, as shown in the table above, are better suited for large volumes of data, whereas smaller datasets are suitable for general chatbot LLMs.
For using a chatbot, verify whether the tool supports uploading CSV or XLSX files. Current popular GenAI chatbots that can analyze data from a user uploading CSV or XLSX files are ChatGPT and Claude. It’s recommended to use the latest model releases for the most advanced capabilities. The table below illustrates using a chatbot LLM for datasets.
Prompt
This dataset contains traffic accident injury data from the UAE government’s open data portal, categorized by accident type for the year 2018. Analyze the data to identify any trends, patterns, or anomalies. Focus on aspects like the most common types of accidents, or other notable correlations and outliers. Provide a brief summary of conclusions.
[Inserted dataset]
GEN AI Generated Answer
From the data provided, I can observe the following:
• Collisions (صدم وتصادم) are the most frequent type of accident resulting in both fatalities and injuries. They account for a significantly larger number of incidents compared to other accident types.
• Rollover accidents (تدهور) are the second most frequent type of accident, leading to both fatalities and injuries, but much less frequently than collisions.
• Pedestrian accidents (دهس) represent a smaller proportion of total accidents but still contribute a notable number of fatalities and injuries.
• The “Other” (أخرى) category has very few incidents, suggesting it might encompass rare or unusual accident types that don’t fit into the other categories.
Across all accident types, the number of injuries is significantly higher than the number of fatalities. This is expected, as injuries generally occur more frequently than fatalities in traffic accidents
Prompt example that demonstrates how to input a small dataset into a chatbot for analysis. Source: Sectorflow. Data source: UAE Open Data Portal
Disclaimer: The mention of the UAE government does not imply or constitute any endorsement.
Alternatively, built-in GenAI assistants, such as Gemini for Google Sheets, Microsoft’s Copilot for Power BI or Excel integrate directly with your data. Depending on the tool, you can generate formula expressions, database query language, organize data model documentation, and create narrative visuals that summarize reports. To test these tools you can begin with simple prompts like creating a chart or table. For an integrated GenAI tool, you don’t need to prepare your data any differently beyond what your preferred software specifies.
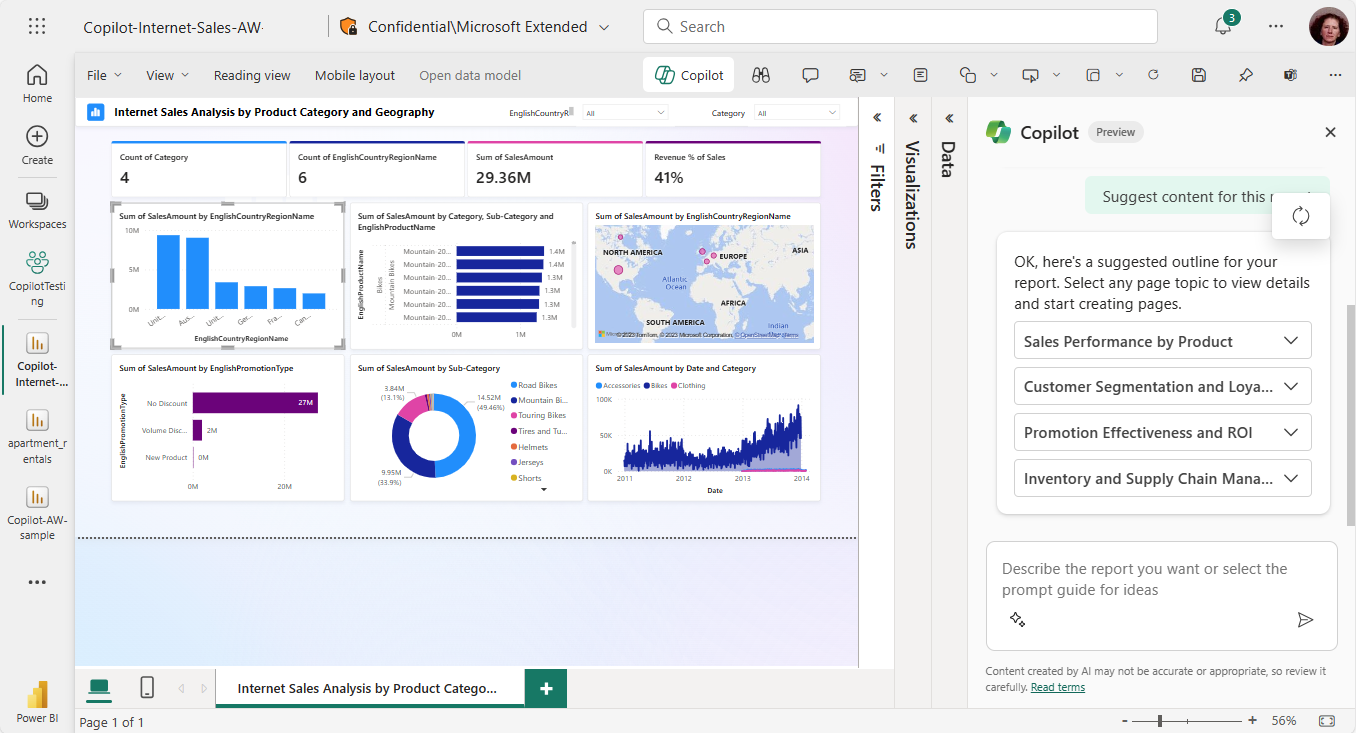
Disclaimer: As of February 2025, Copilot primarily supports English; using it with other languages may lead to lower quality and less accurate results. Read more considerations and limitations on the Overview of Copilot for Power BI
Generative AI Use Case

Broad Trial Adoption of a GenAI Tool by Australian Civil Servants
The Australian Public Service conducted its first trial of adopting a GenAI tool, focusing on Copilot’s integration within the full suite of Microsoft 365 applications. The trial evaluated the effectiveness of Copilot to increase productivity and streamline tasks for civil servants. Diverse agencies from across the Australian government participated, testing various functions within Microsoft 365. A key area of focus was data analysis using Copilot in Excel, where participants explored tasks like creating formulas, analyzing datasets, and producing visualizations. Watch the briefing video to discover how Australian civil servants used the GenAI tool, what they found most useful, and the challenges they faced during the trial.
Democratize Visualization
AI tools make it faster to explore data and build visualizations that align with your objectives. Instead of manually creating each visualization, you can simply upload your data to the GenAI model and use prompts to generate both visualizations and insights. With additional prompting, you can refine the outputs by adding custom filters, color markers, or other customizations. This approach also makes data visualization more accessible for those with less experience, as it simplifies the process and can even help identify the best charts to effectively represent your data. It also makes advanced software easier to use for creating simple charts and diagrams to quickly share data with the wider public or present insights to leadership.
Generative AI Use Case

Data Visualization to Inform Policy Decisions
In this scenario, a Policy Analyst at Singapore’s Building and Construction Authority (BCA) is tasked with evaluating the performance of the Green Mark certification on various building projects over the past twenty years. To streamline the process, the analyst uses a GenAI assistant, Tableau Agent, to quickly create a visualization and identify insights. The resulting visualization highlights how different project types contribute to the average Gross Floor Area (GFA) within each Green Mark rating, revealing which certification levels correspond to the largest projects. This helps inform urban planners’ decisions on space allocation and project prioritization.
Disclaimer: The mention of Singapore’s BCA does not imply or constitute any endorsement.
The data for this scenario is sourced from Singapore’s open data portal. See Get Your Data Tableau-Ready for best practices in preparing your data for Tableau.
Prompt
“How does the average Gross Floor Average (GFA) compare across different Ratings?”
Gen AI Generated Answer
OK. I’ve created a bar chart to compare the average GFA across different ratings.
Prompt
Include “Project Type” as a color mark to see how different types of projects contribute to the average GFA within each rating
Gen AI Generated Answer
Got it. I’ve added “Project Type” to the color shelf to show how different types of projects contribute to the average GFA within each rating.
Experiment with Future Scenarios
You can also use a GenAI tool for predictive analysis to forecast scenarios. Using historical data, the tool analyzes past datasets to predict future needs. By incorporating a chatbot into the forecasting process, you can input historical trends, simulate various scenarios, and develop comprehensive contingency plans. In this context, a chatbot can serve as an interactive partner, providing diverse perspectives and ideas. See our Save Time on Writing and Editing tip to review how to brainstorm ways to prompt the GenAI tool. This proactive approach helps explore a wide range of potential outcomes, enabling decision-makers to determine suitable strategies to address potential challenges.
You can use an existing chatbot or a specialized predictive analysis model that handles diverse datasets. For example, Akkio uses GenAI to train and test predictive models. For using a chatbot, follow along this step-by-step guide for incorporating a GenAI tool in your scenario planning process.
Generative AI Use Case
HDOT Climate Insights
The Hawaii Department of Transportation (HDOT) is utilizing AI-powered tools from Google, including Google Earth Engine and Google Cloud, to improve climate resilience planning. By deploying a Climate Resilience Platform, HDOT can assess risks, prioritize investments, and analyze infrastructure impacts. The platform integrates diverse data sets into a visual mapping tool, categorizing risk levels to support decision-making for lawmakers and the public. This enables HDOT to predict climate-related threats such as coastline erosion and flooding, ensuring strategic resource allocation and infrastructure adaptation. (Source: HDOT)
Disclaimer: The mention of the Hawaii Department of Transportation (HDOT) does not imply or constitute any endorsement.
Questions to Consider When Tailoring The Tip:

Disclaimer: Bias is an inherent risk in any data analysis and visualization process. AI-generated results can reflect or amplify biases present in the data or model which can lead to misleading information. Always validate these outputs before disseminating or making decisions based on results.
- What types of analysis or visualizations does your team and department typically handle, and how can the GenAI tool adapt to these needs?
- What objectives and/or insights are you pursuing for your analysis? Knowing your goal is crucial to prompting the GenAI tool for the most accurate and relevant results.
- Prior to any analysis, has the dataset itself been validated?
- What safeguards does the tool have to protect sensitive data and comply with privacy regulations?
- How can potential biases in AI-generated analysis be mitigated?
- What training resources and documentation are available to help you understand and safely use the tool?
- How does the tool integrate with your existing data governance and compliance framework?