In Denmark, like many other countries, a disquieting trend emerges: not just a tale of two cities, but increasingly, a tale of two countries as economic inequality between regions and across communities continues to widen. Educated young people are migrating from underserved communities to large urban areas in pursuit of education opportunities, better pay, and better jobs.
In their wake, less densely populated areas and communities are struggling under the weight of fewer opportunities and a lack of young people to carry the areas forward.
Meaningful solutions exist to support underserved areas, reduce inequality, and direct public resources more effectively and equitably, but not without a deeper understanding of the local context. At Aalborg University, a small team of researchers is having an outsized impact with an interactive website where policymakers, urban planners, and other decision-makers can explore key indicators—and levers of change—related to economic prosperity.
The access to that data is really challenging and unequally distributed. It renders some communities invisible, so I'm very interested in democratizing data.
Malene Rudolf Lindberg, Ph.D. Postdoctoral researcher in the Department of the Built Environment Aalborg University

The Challenge
Denmark has a considerable amount of administrative data, much of which is already publicly available through Statistics Denmark. Still, much of the information is not accessible at the fine-grained level that is needed to understand local demographic trends and counteract challenges. Raw data downloads, for example, are only useful for stakeholders with high data literacy and enough time and capacity to conduct their own analysis.
Unlike countries like the United States, where census tracts provide insight into trends in specific areas over time, Denmark is divided into 98 divisions, or municipalities, that are quite large, geographically and do not align with postal codes, which are subject to change. As a result, data from these 98 divisions is unreliable as a useful marker of local challenges and contradictions at the neighborhood level.
Dr. Elise Stenholt Lange, a self-proclaimed “data nerd” and a postdoctoral researcher in the Department of the Built Environment at Aalborg, knew that there was a better way. She wanted more data, more granularity, and more actionable information to drive change.
“We lack a very detailed geographical scale to study cities and study neighborhoods,” she said. “I was drawn to this idea where you could democratize data and communicate data in a more accessible language. I want my work and other peoples’ work to be used in society.”
So, a small, determined group within the department set out to create a tool that could make data on economic inequality and prosperity accessible to all—and change the policymaking landscape in Denmark in the process.
Sometimes you need to take on a challenge and push boundaries. You need the courage to possibly not succeed.
Elise Stenholt Lange, Ph.D. Postdoctoral Researcher Aalborg University
The Solution
Born from Stenholt Lange’s vision and supported by the university, the BUILD team applied for data.org’s Inclusive Growth and Recovery Challenge, a global initiative to invest in breakthrough ideas thanks to funding and support from the Mastercard Center for Inclusive Growth and The Rockefeller Foundation. BUILD was selected as one of nine awarded projects around the world as they set out to test their theory for more inclusive data systems.
Developed during the pandemic, “Mapping the Regional Quality of Life” had to begin with better data.
“Planners need better access to data and more fine grain data so they can study their specific community at a more local level. The access to that data is really challenging and unequally distributed. It renders some communities invisible, so I’m very interested in democratizing data,” said Dr. Malene Rudolf Lindberg, a fellow postdoctoral researcher with a background in sociology and urban planning and the other half of BUILD’s current two-person operation.
“Planners need better access to data and more fine grain data so they can study their specific community at a more local level. The access to that data is really challenging and unequally distributed. It renders some communities invisible, so I’m very interested in democratizing data,” said Dr. Malene Rudolf Lindberg, a fellow postdoctoral researcher with a background in sociology and urban planning and the other half of BUILD’s current two-person operation.
How to begin that process was something that kept the team up at night. In academia, researchers are often working on projects well within their established area of expertise. For Stenholt Lange, the creation of new, consistent residential areas was beyond her skill set.
“Sometimes you need to take on a challenge and push boundaries. You need the courage to possibly not succeed,” she said. “You need to have dreams about something that is beyond your own capability and then try to find the people who can help solve it for you.”
Those problem-solvers came from the data.org network. As part of the Inclusive Growth and Recovery Challenge, BUILD connected with Data Clinic – Two Sigma. Together, they were able to develop an algorithm for creating new, more localized residential areas. Population data was then organized and aggregated on core socio-economic indicators, including housing prices, education levels, wage levels, access to education, migration rate, and labor market status.
All that information is now publicly available. Users can compare the development, growth, and challenges of geographic areas over a 30-year period, better understanding the data through interactive maps and graphs that illustrate key highlights.
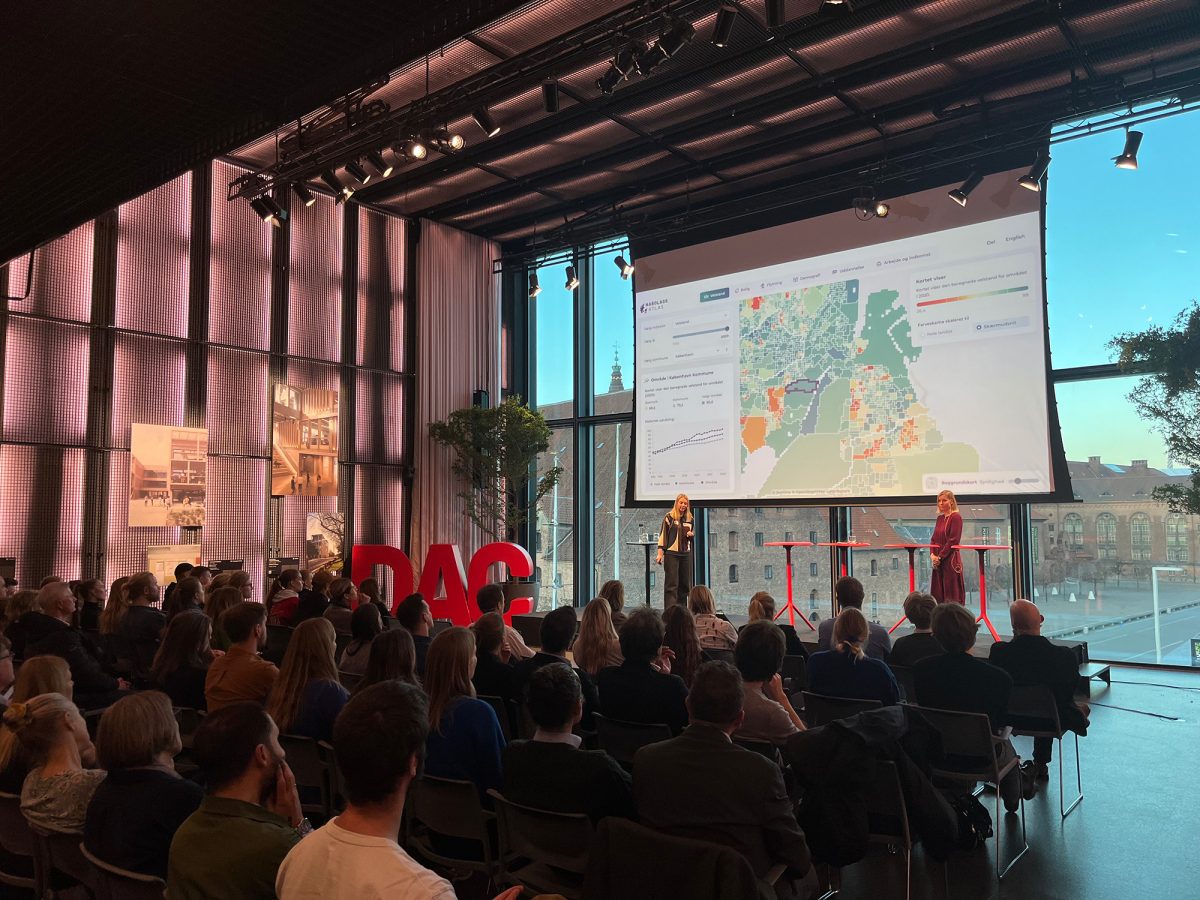
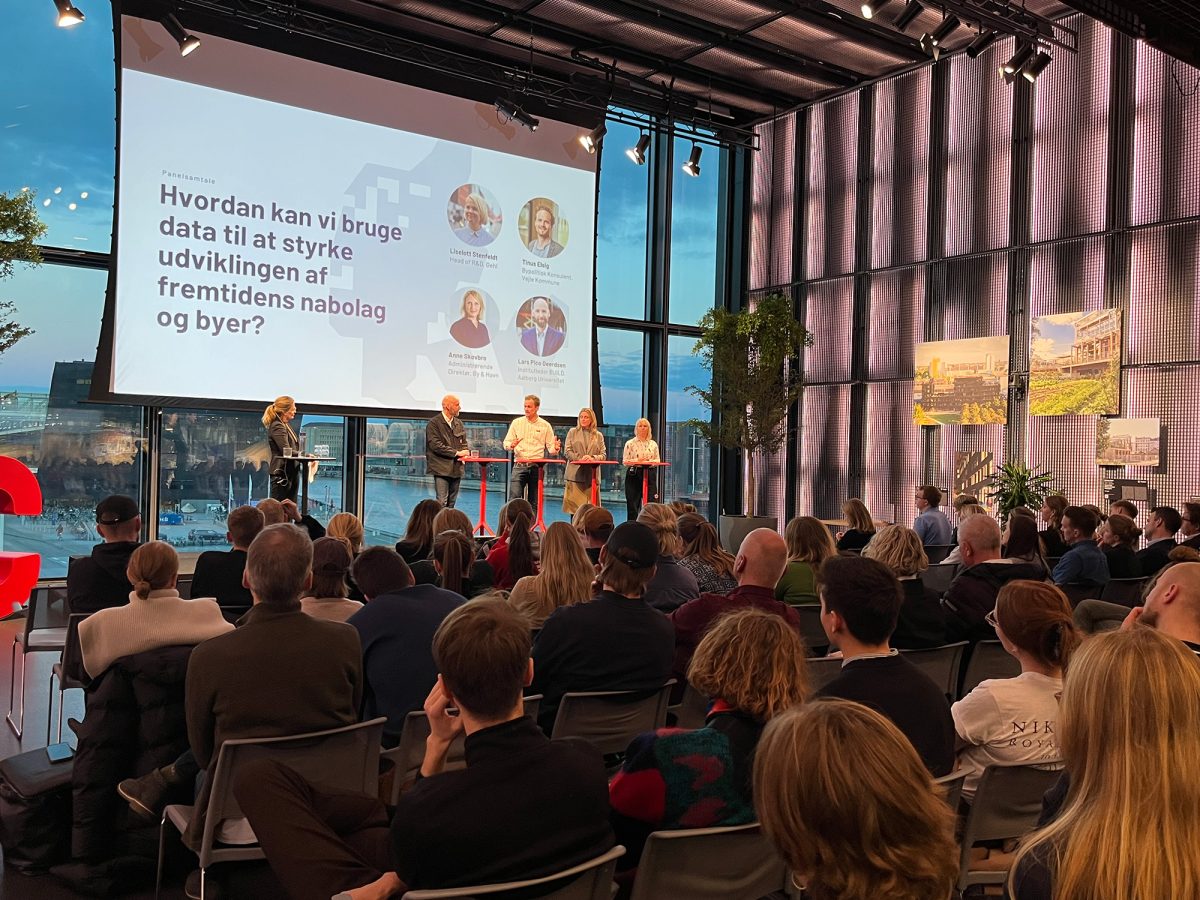
At BUILD’s launch event, the room was overflowing.
“A turning point for me has been some of the interactions with local community representatives or local planners, saying ‘wow, this is really what we need. Is this really for us to use, for free?’ Rudolf Lindberg said. “That has been reassuring.”
The answer to that last question is yes; the tool is free. All data collected and analyzed by BUILD is open source.
In the City of Vejle, policymakers used socio-economic data on neighborhoods to push back on a piece of legislation called the Parallel Society Act, which sought to demolish low-income properties to increase “social mix.” The effort was successful, and a less drastic intervention emerged. In another instance, an associate professor from the University of Copenhagen is using The Danish Neighborhood Atlas in his course on regional and urban development.
The Takeaway
The biggest surprise of BUILD has been not in the data but in the people: both the unexpected users and the capacity of the intended audience.
On the former, both researchers said they were surprised at the launch event how many private companies, consultants, developers, and even insurance companies were present and interested in the tools.
Yet when it comes to BUILD’s priority audiences, they have found that the capacity to analyze and apply the data is hugely variable depending on the municipality or stakeholder, and public entities struggle to compete for top talent with private companies offering better pay. Universities, for example, often operate on short-term contracts, leading to turnover that exacerbates the challenges in recruitment and retention.
Understanding use cases and building that capacity to use the data for social good is the focus of the next few years, along with refining the datasets and applying their learnings and approaches to other countries.
“We are very interested in doing more research into data implementation and data use in urban planning processes,” Rudolf Lindberg said. “It’s clear that there are so many inequalities here, both regarding the access, the skill levels, how it’s used in the political process, so that could be very interesting to study.”
As these partnerships develop, Stenholt Lange hopes more audiences will use and value the tool, and more young professionals will consider careers that advance the work.
“It’s nice to have a job you feel is meaningful,” she said. “I have this fire in me and I want to work with other people where you can have this ping pong, back and forth. In this field, you can continue developing your own skill set, developing new methods, learning new things.”