Understanding the Challenge
Developing skilled practitioners addresses only one part of the capacity challenge. Their ability to meaningfully use data and AI depends on the readiness of the organizations where they work.
Organizations may have talented staff and significant amounts of data but still struggle to translate them into better decisions or services. Data can remain fragmented or inaccessible; priorities may be unclear; and teams may lack the processes, infrastructure, leadership support, or organizational culture needed to adopt new approaches. Growing interest in AI can compound this challenge by encouraging organizations to begin with technology before establishing whether the underlying problem, data, people, and systems are ready for it.
Organizational readiness, therefore, requires organizations to understand what they are trying to achieve, where they are today, and what combination of people, practices, systems, and partnerships they need to move forward responsibly.
Our Approach
The CAN APAC Hub approaches organizational capacity building with two key principles:
- Readiness before implementation: Organizations need opportunities to identify meaningful use cases, understand their capabilities and constraints, and prioritize realistic next steps before investing in solutions. For one organization, that may mean improving basic data practices; for another, integrating fragmented datasets; for another, testing an AI-enabled application.
- Embedding capability inside organizations: External expertise can help organizations get started, but sustainable capacity requires staff to participate in defining problems, interpreting data, developing and testing approaches, and incorporating new practices into their workflows.
Different models provide different levels of support along this journey. The Data Maturity Assessment (DMA) creates a structured starting point for understanding readiness; Finverse helps organizations explore approaches to financial-health data challenges, with the Finverse Fellowship providing deeper implementation support; and the Social Impact Data Science Accelerator (SIDSA) connects organizations with academic teams around real organizational needs.
Across these models, the starting point remains the same: understand the organization and its problem before determining the role technology should play.
In Practice
Data Maturity Assessment workshops
For many organizations, strengthening their use of data and AI begins with understanding where they currently stand. data.org’s Data Maturity Assessment (DMA) provides a structured starting point, helping them examine their maturity across purpose, practice, and people, alongside their readiness to adopt AI.
DMA Model
From assessment to action
01Assess current maturity
Organizations score themselves across purpose, practice, people, and readiness to adopt AI.

02Interpret results
Facilitated reading of the results, so scores become a shared picture rather than a grade.
03Discuss strengths and gaps
Teams name what already works and where capability, data, or skills run thin.
04Identify priorities
Which gaps matter most for this organization’s own goals — not every gap at once.
05Commit to next steps
A small set of realistic actions, sized to current capacity and constraints.
06Access relevant resources
Guides, training, and tools matched to the priorities the organization has chosen.
One assessment, an organizational conversation
Organizations assess themselves rather than being externally evaluated or benchmarked. Facilitation is what turns an individual score into a shared decision about what to strengthen first — basic data practice for one organization, integrating fragmented data for another, testing an AI-enabled application for a third.
While organizations can use the DMA independently, facilitated workshops turn the assessment into a shared organizational conversation. Participants assess their organization, interpret their results with peers and facilitators, identify gaps that matter most to their priorities, and consider realistic next steps.
The Hub has applied this approach across different parts of the APAC ecosystem:
- With the Asian Venture Philanthropy Network (AVPN), data.org led Building Data and AI Maturity for Social Impact: A People-First Approach for over 250 funders, nonprofits, and social innovators across the region.
- In partnership with the Alliance for Digital Finance and Fintech Associations (Alliance DFA), the Data and AI Readiness for Impact Workshop reached over 120 participants from 36 countries, with particularly strong participation from India, Nepal, Pakistan, Indonesia, and Bangladesh. Participants examined priorities spanning strategy, infrastructure, talent, culture, responsible use, and AI adoption.
- At Better.sg’s BEACON 2024 Tech for Good Conference, data.org introduced the approach to more than 270 innovators, changemakers, and technology practitioners exploring how technology can contribute to social impact.
It is a much-needed reality check for grassroots organizations. It shows you exactly where your operational gaps are, helping you transform raw community data into a secure, structured asset to make highly accurate, data-driven decisions on the ground.
Org name: Setu Abhiyan and Participant’s Name: Dhaval Chad, Setu Abhiyan
Across these applications, facilitated use of the DMA turns an individual assessment into an organizational conversation about priorities and action.
Finverse Tool & Fellowship
As the CAN APAC Hub’s financial-health work expanded, organizations encountered different versions of a common problem: they wanted to make better use of data but struggled to identify relevant datasets, connect fragmented sources, or translate available information into decisions.
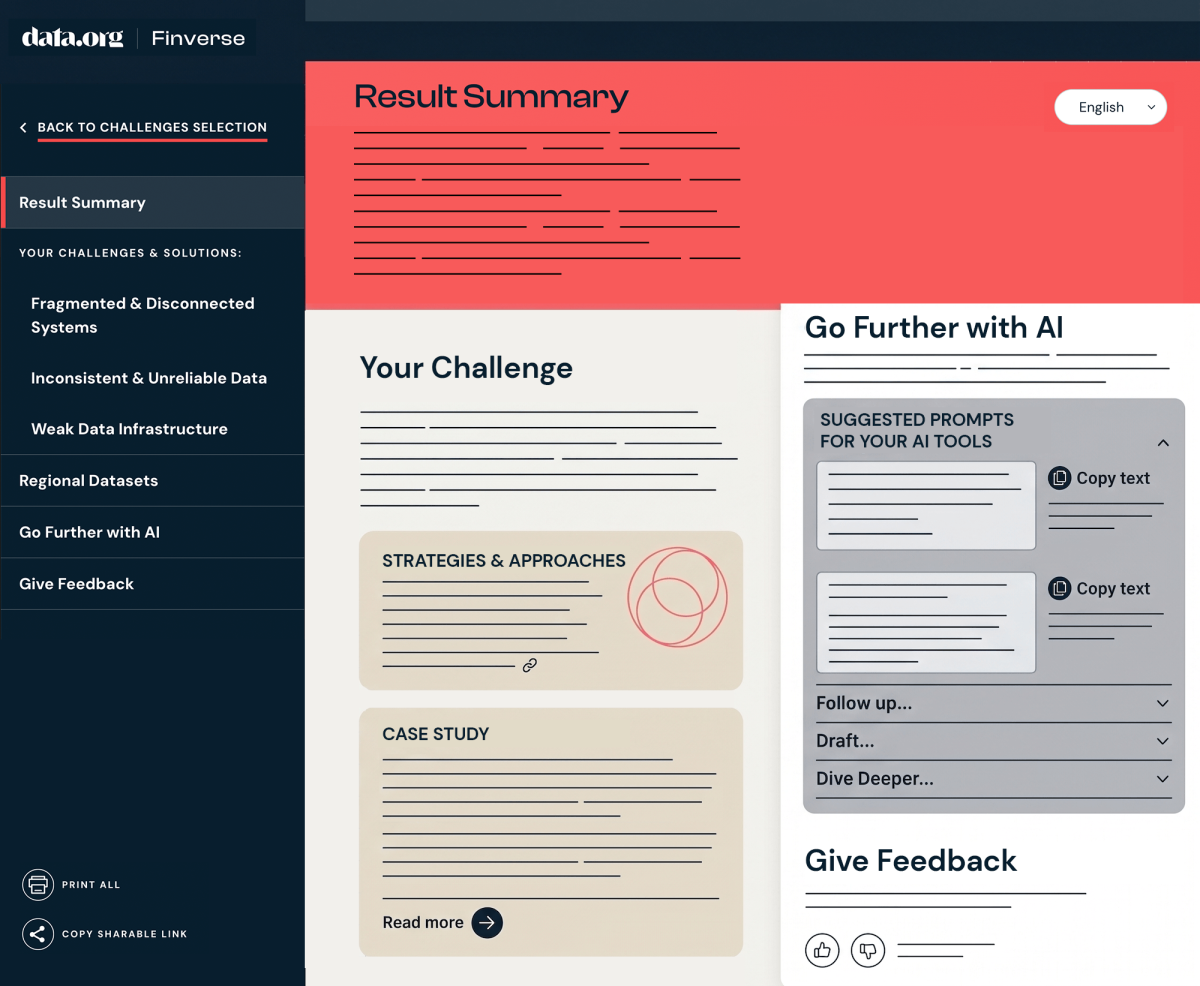
Finverse was developed as an open-access decision-support tool in response. Currently focused on India, Indonesia, Malaysia, the Philippines, and Singapore, it connects common financial-health challenges with relevant data approaches, local datasets, case studies, learning resources, and curated AI prompts.
A user-centric development process was used, drawing on practitioners and experts from financial institutions, philanthropy, and social-impact organizations through design workshops, interviews, testing, and expert review. The Hub has subsequently introduced Finverse through ecosystem engagements, including CFIG’s APAC Collaboration Café and the APAC financial-health hackathon, where teams used the tool with real-world partner organizations.
Finverse Model
01Identify a data challenge
Name the financial-health question the organization is trying to answer.
02Explore recommendations
Matched data approaches, local datasets, case studies, and learning resources.
03Define a use case
Turn the challenge into a specific, scoped use case for the organization.
04Find a route to adoption
Use the tool independently, or through a supported programme such as a fellowship or hackathon.
05Test and implement
Try the approach on real data, then put what works into practice.
06Generate practical examples
Document what happened so others in the region can build on it.
One pathway, many ways in
Organizations enter wherever their challenge sits — finding relevant datasets, connecting fragmented sources, or translating information into decisions. The tool is open for any organization to use on its own, and it is also embedded in supported programmes — fellowships, hackathons and similar formats — and build data and AI solutions for financial health.
The Finverse Fellowship further extends this pathway from exploration towards implementation. Nearly 50 organizations applied to the first cohort. Over approximately six months, selected organizations receive microgrants, technical assistance, peer learning, mentoring, and technical office hours, with support tailored to each organization’s project rather than a uniform curriculum.
Finverse Fellowship Journey
01Organizational challenge
An operational problem the organization already faces.
02Fellowship selection
A cohort is chosen through an open call.
03Project definition
Each organization scopes the project it wants to take on.
04Microgrant and technical support
Funding alongside hands-on technical assistance.
05Peer and expert learning
Monthly cohort sessions, mentoring and technical office hours.
06Implementation
The approach is built and tested in the field.
07Documentation
What worked is written up and shared back.
Approximately six months for the initial cohort, from selection to reporting.
Support follows the project
Every organization arrives with a challenge it already has. Selected organizations receive a microgrant, technical assistance, peer learning and expert support, shaped around their own project rather than a uniform curriculum. Support spans data and AI, product development, monitoring and evaluation, and responsible AI. What each organization learns is documented so others can build on it.
The first cohort illustrates the range of applications being tested:
- In India, eKutir is developing an alternative risk-scoring approach for farmers using crop, weather, market, land, and financial-health information.
- In the Philippines, Grameen Foundation is exploring how richer farmer-level data collected through agricultural cooperatives could support more responsive financial products.
- In Indonesia, Solve Education! is developing a self-service dashboard to continuously track livelihood and financial-health outcomes.
Other fellows are exploring applications including AI-assisted qualitative assessment, alternative credit scoring, financial-behavior data, and more efficient supply-and-demand systems.
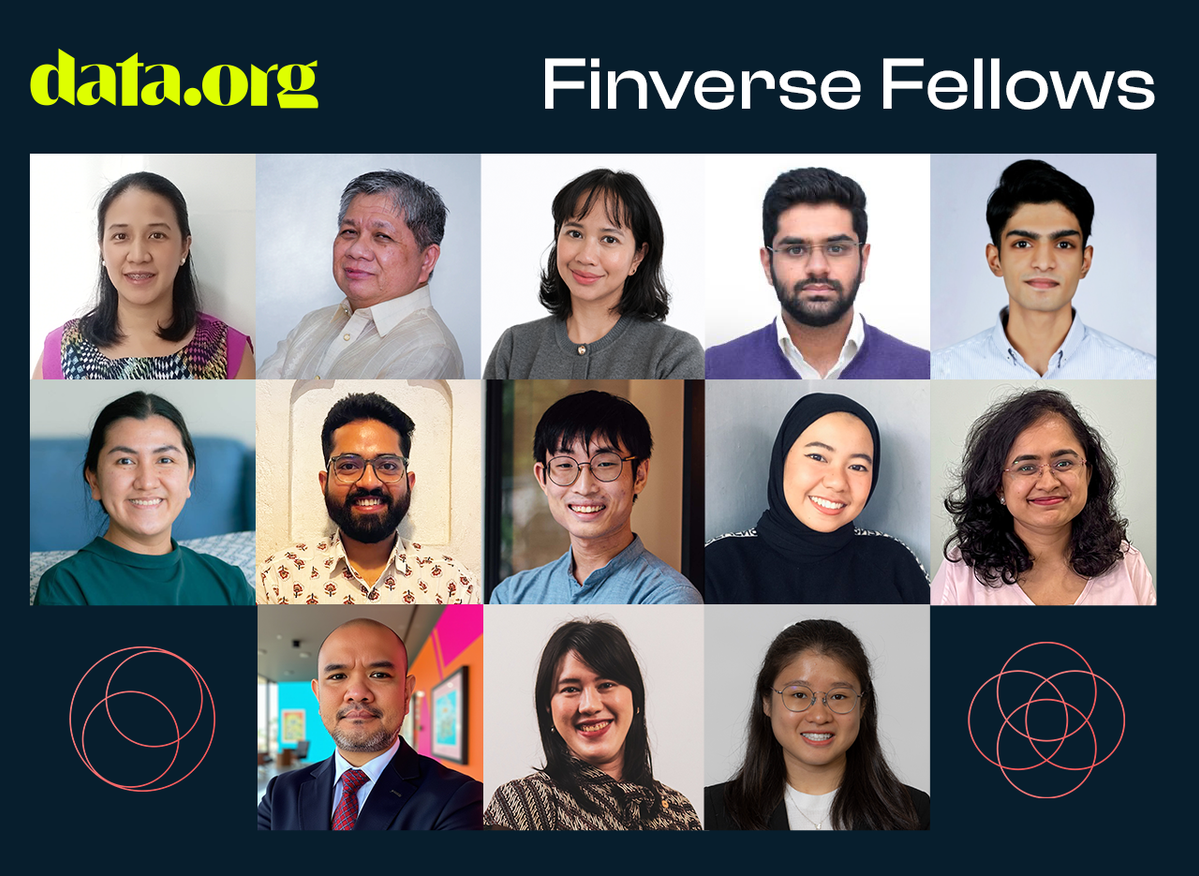
The first cohort is still implementing its projects, with end-of-project reporting expected by December 2026. It is therefore too early to draw conclusions about outcomes. At this stage, the Fellowship demonstrates the pathway being tested: an open resource helps organizations identify possible approaches, while deeper support enables selected organizations to put them into practice.
SIDSA
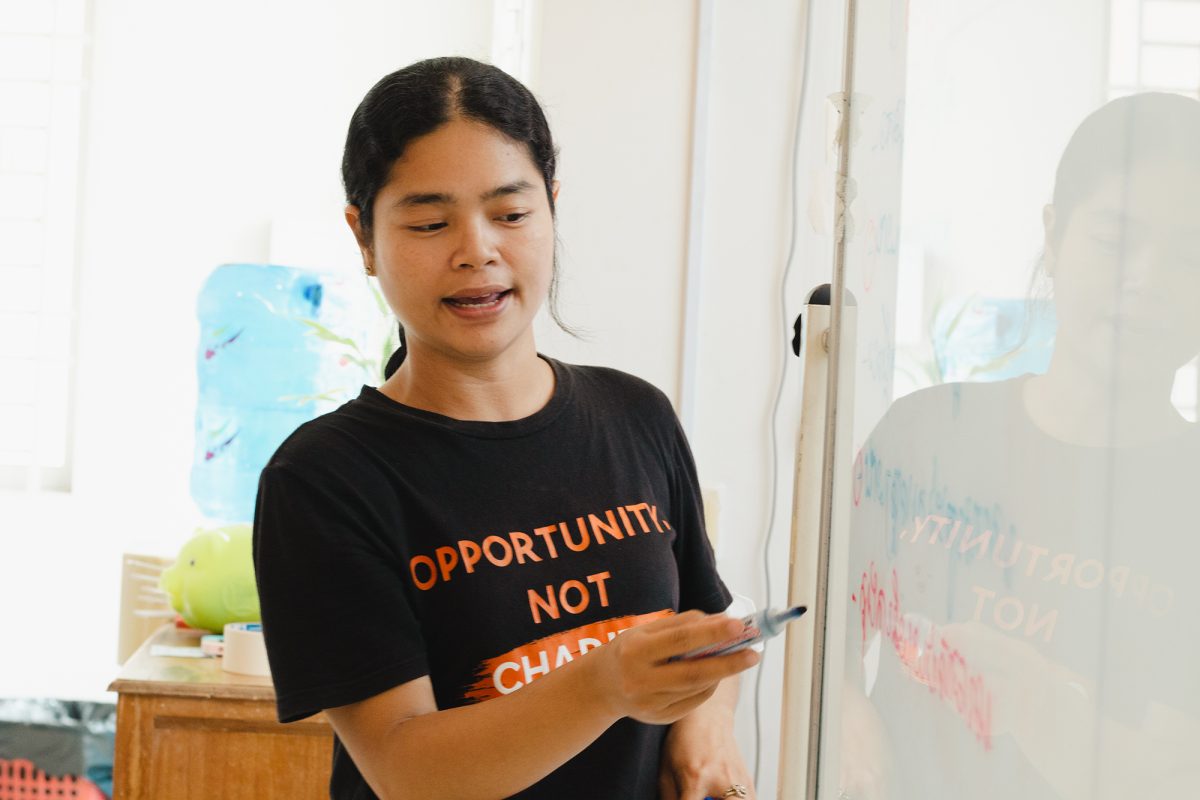
The Social Impact Data Science Accelerator (SIDSA) connects MSMEs and social-impact organizations with university data and AI teams around real organizational challenges. Initiated by data.org and APRU and implemented by Tandemic, with Dr. Michelle Banawan as academic lead, the model gives organizations access to analytical capability while providing emerging practitioners with experience working on real-world problems.
Two-Sided Capability Gap

MSMEs & social-impact organizations
Rich operational data, little capability to use it.
Data, without the means
SIDSA brings the two together


University data and AI teams
The capability, but little real-world data to learn on.
Means, without the data
The first pilot brought together three partnerships across APAC addressing food security and livelihoods, women’s economic empowerment, and sustainable supply chains.
From Organizational Need to Data Use Case
SIDSA begins with the needs and existing data of the organization. To help organizations translate operational challenges into possible applications, the program developed eight data-use archetypes.
The Menu of Eight Archetypes

Targeting and personalization

Resource and operations efficiency

Predictive analytics and early warning

Evidence-based planning, policy, and programme design

Data integration and visualization

Efficient and inclusive data gathering

Monitoring, evaluation, and learning

Beneficiary engagement and empowerment
Organizations initially identified two or three possible use cases, which were translated into briefs used to recruit and match academic teams. Maintaining more than one possibility created flexibility between organizational priorities and university expertise. Readiness was also part of the selection process. Having data was not sufficient: it needed to be accessible and usable enough to support collaborative work. Some partnerships in the wider pipeline were therefore not pursued because their data or systems were not yet ready.
An Organization-Led Process
Start with the data
Organization maps its own data
What it already collects, where it lives, what it could answer.
Pick the question
Chooses use cases from a menu of eight archetypes
A shared vocabulary of common data problems to select from.
Frame the work
Use-case brief
A short, plain-language statement of the problem and the desired outcome.
Match the team
Academic team recruited and matched
A university data-science team paired to the brief and the sector.
Do the work
Four-phase engagement
A structured 8 to 12 week journey with reflection built in.
Once matched, organizations and academic teams moved through four broad phases:
Four-Phased Engagement
Phase 1
Review
Understand the data, the context, and what good would look like.
Phase 2
Design
Shape the approach and the solution with the organization.
Phase 3
Prototype & Test
Build a working version and try it against real conditions.
Phase 4
Deploy & Handover
Put it into use and transfer ownership to the organization.
Initial use cases provide a starting point rather than a fixed technical specification, allowing teams to collaboratively adapt as they encounter actual data, workflows, users, and constraints.
Three Partnerships, Three Applications of the Model
The first SIDSA cohort matched three MSMEs and social impact organizations with university teams. While each partnership followed the same broad model, the nature of the work differed depending on the organization’s data, users and decisions.
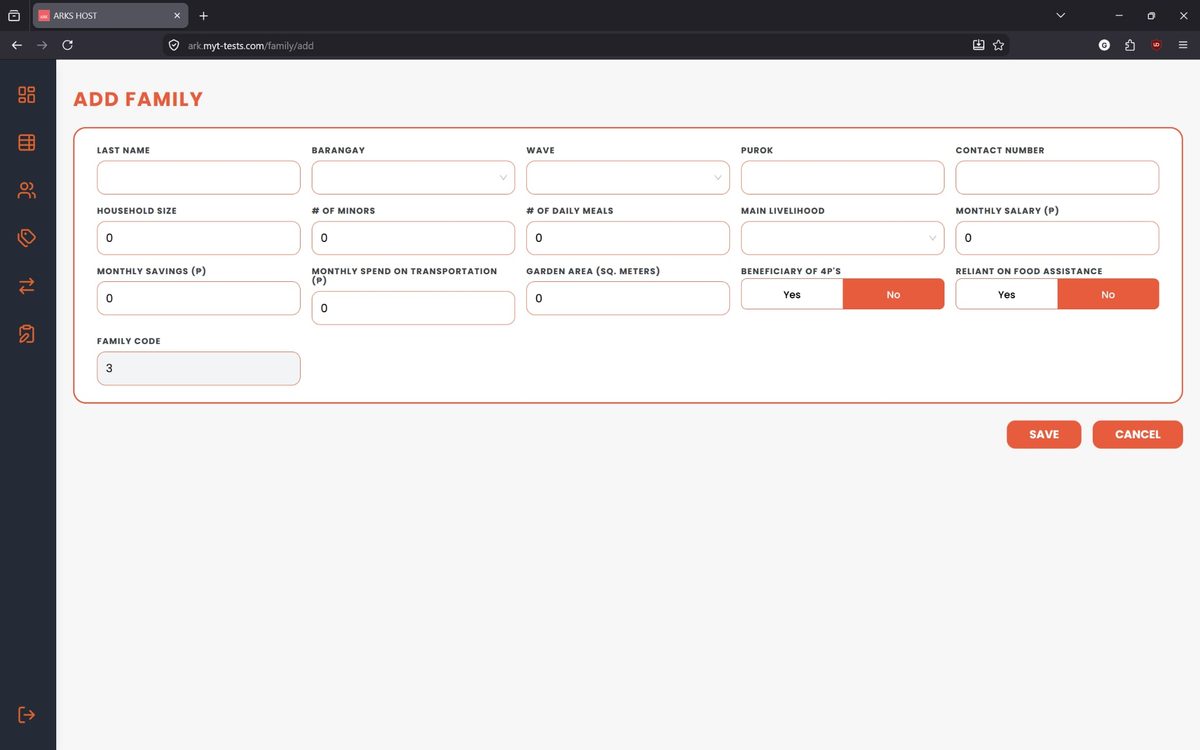
ARK Solves works with smallholder farmers and fisherfolk in the Philippines through Feed Back, its community vegetable exchange program. As the program expanded, monitoring information became fragmented across paper records and separate spreadsheets.
The University of the Philippines team first mapped ARK’s data workflows and validated them with staff before developing mock-ups. The resulting prototype combined a consolidated database with a field data-collection system, while retaining paper-based processes for communities with limited connectivity.
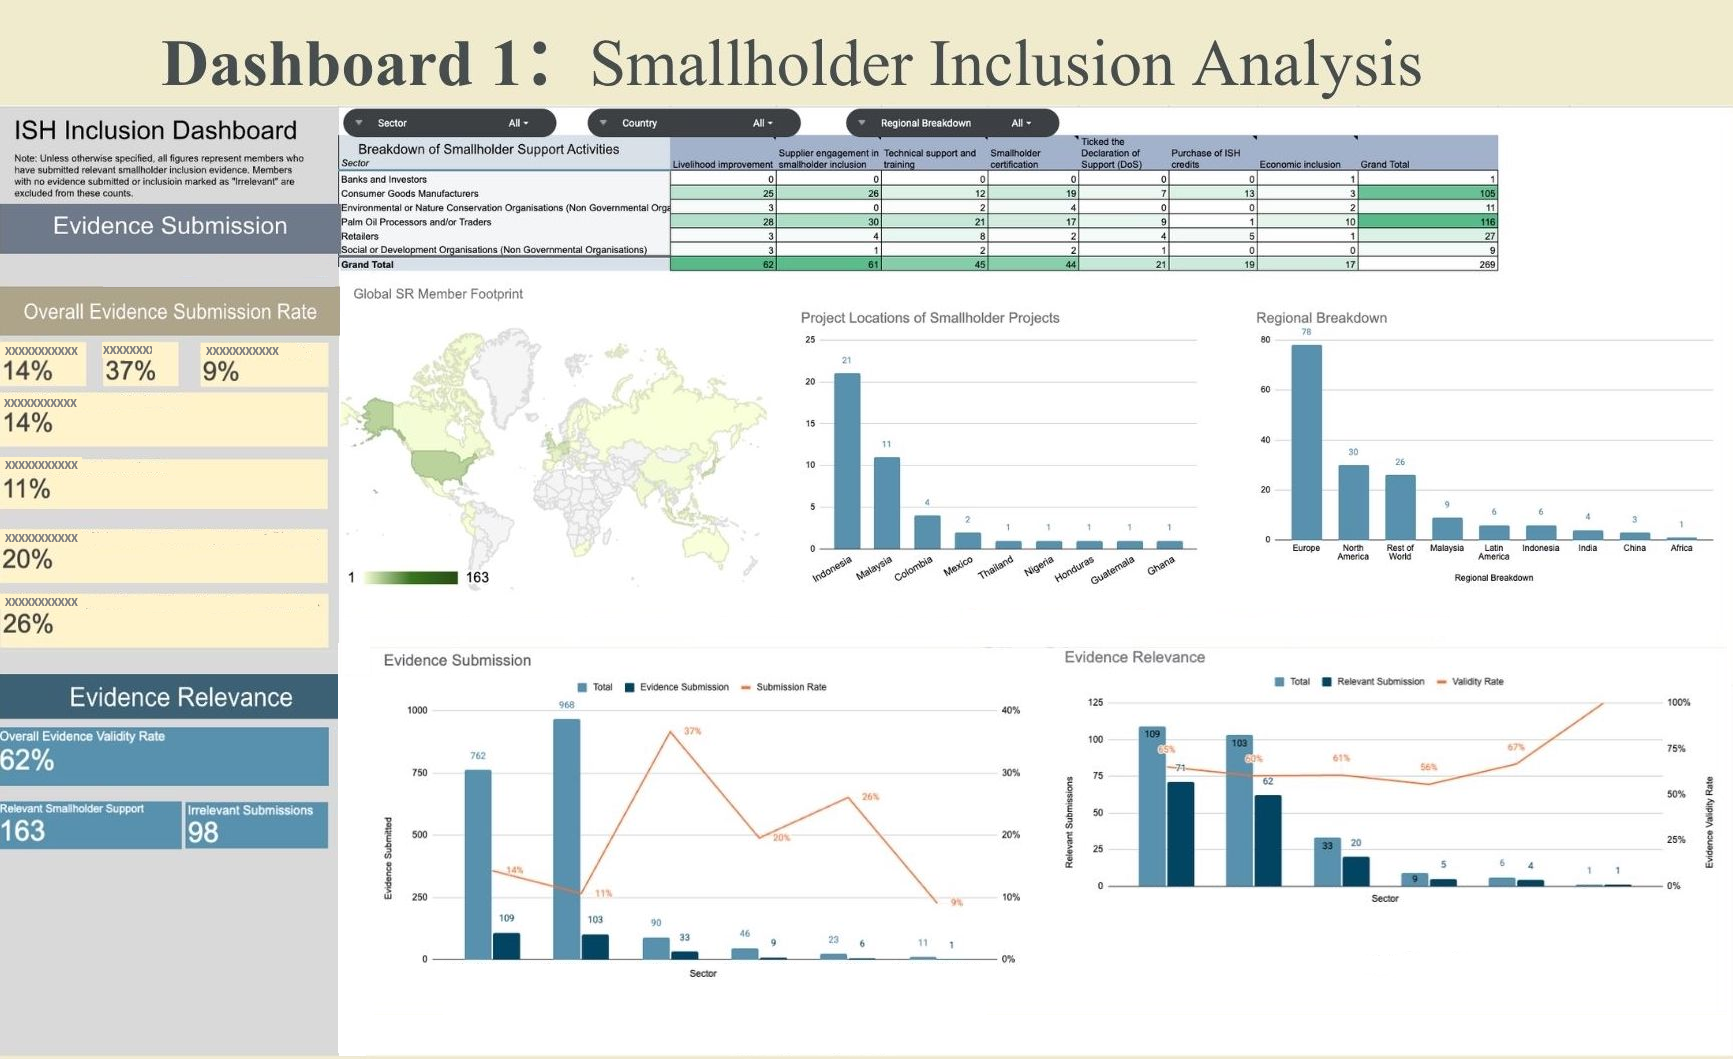
The Roundtable on Sustainable Palm Oil (RSPO), a global partnership to make palm oil sustainable, leveraged SIDSA to examine member reporting on commitments to smallholder inclusion. Analysis of reporting on smallholder inclusion found several gaps and inconsistencies.
The academic team extracted and classified the information and developed a dashboard that helped RSPO identify reporting patterns and organize members according to their reported engagement. RSPO subsequently re-engaged members on missing information and reconciled reporting channels. The solution was ultimately converted into a spreadsheet-based tool that staff could maintain without specialist analytical software.
The iDE partnership illustrates how projects can change when organizational priorities change. The original engagement focused on Kotra Riel, a mobile bookkeeping application for entrepreneurs in Cambodia, but external development issues meant the application was unavailable for much of the project period.
The partnership shifted towards other organizational needs, including analysis of a decade of fragmented impact data. The resulting AI-assisted analysis consolidated information across ten programs reaching 1,700+ entrepreneurs. iDE used the work to finalize a revision of its impact framework that had remained unresolved for two years, reconsider indicators highlighted to funders, validate previous manual calculations, and remove reporting processes creating survey burden without useful insight.
The outputs differed—a database and field application, a maintainable reporting tool, and an AI-assisted analysis—but each emerged from the organization’s own data, decisions, and operating context. Organizational staff remained involved in defining problems, refining requirements, interpreting findings, and determining how outputs could fit into existing work.
SIDSA therefore brings two sides of capacity building together: strengthening organizations’ ability to use data while giving emerging practitioners experience in translating technical capability into organizational decisions.
Voices from SIDSA
Our motivation for developing this program is that we want students and academic teams to engage with projects that tackle real-world problems. We want to provide a venue where the things they study and learn within the four corners of the usual learning space can extend beyond those boundaries and have a meaningful impact on society
Professor Michelle Banawan, Academic Lead for SIDSA
This project has given me good visibility of how to deal with this part of the data that we’ve never looked into. What really worked is that this is part of students’ final-year project. That becomes something that they are very invested in, because they contribute to it.
Cheryl Ong, Senior Manager, Research & Knowledge Management, RSPO
This project was really a first for me in terms of putting my computer science knowledge into the world. I’m very grateful to have had this opportunity. It reminded me that, outside the classroom, there are many ways I can help people around me.
Zachary Paul Matriano, a participating student at the University of the Philippines.
Related Story
Pathways to Impact
Growing the Data Systems Behind a Growing Program: ARK Solves, Philippines
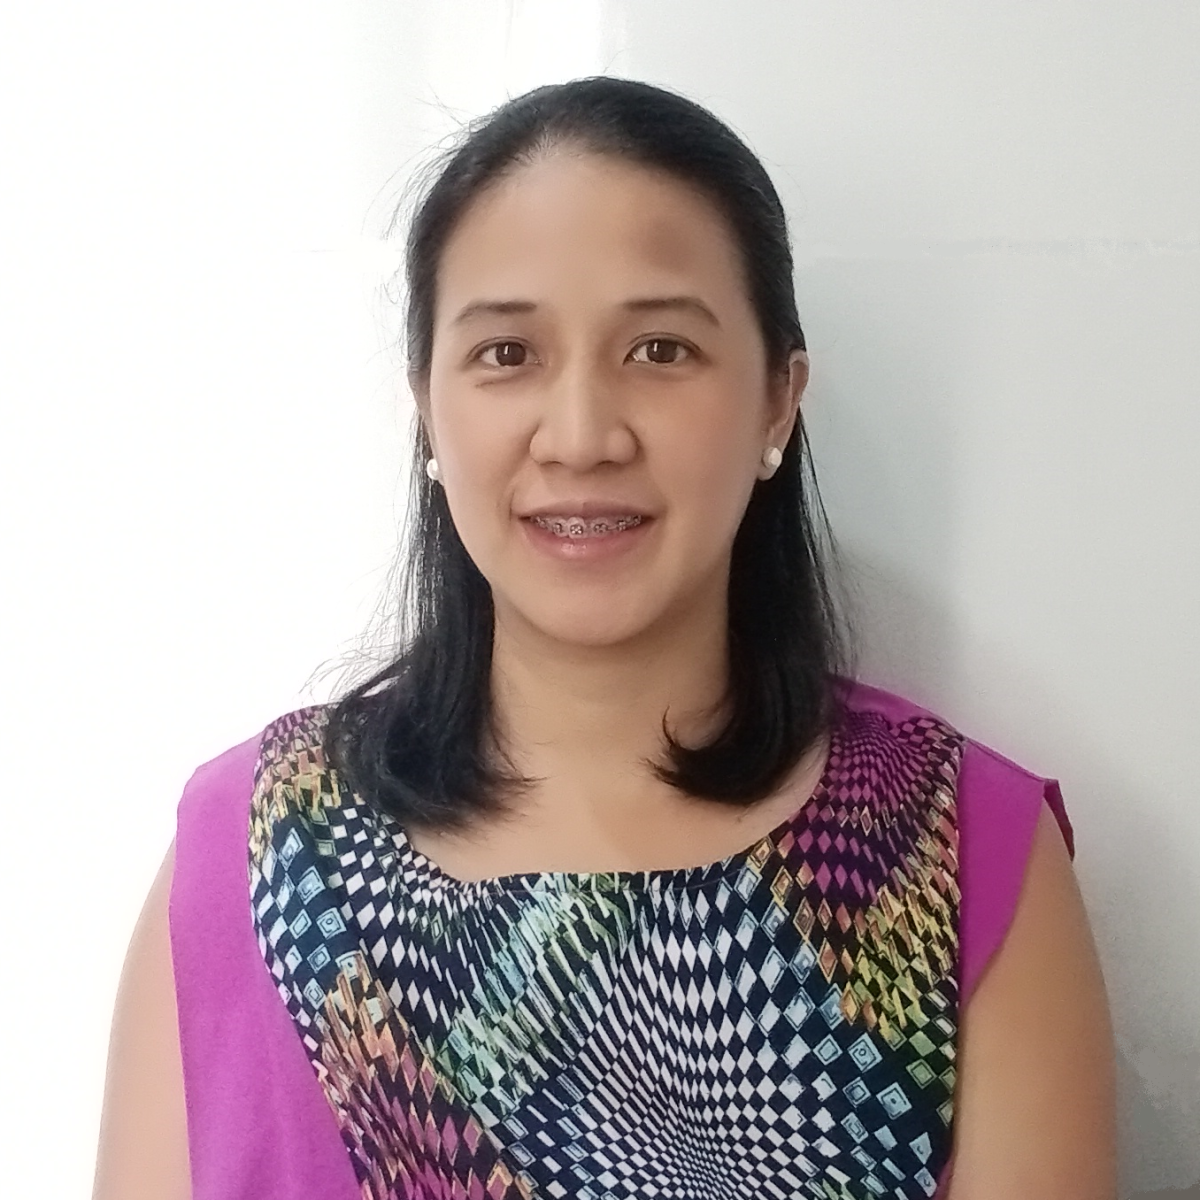
Through the experience of Ana Katrina Santos, Impact Manager, ARK Solves
The organizational challenge
ARK Solves’ Feed Back initiative began with a simple model: families grow their own food and share the surplus with their neighbors. As the program expanded to 123 communities and approximately 36,500 families, the information needed to track that work became increasingly difficult for a small team to manage. Data spread across paper records and separate spreadsheets required significant staff time to consolidate and analyze.
Ana Katrina Santos and ARK’s impact team wanted to ensure that insights from the communities were not only manageable but also actionable—fueling Feed Back’s continued growth and impact.
Building around organizational realities
Through SIDSA, ARK partnered with a multidisciplinary team from the University of the Philippines. Rather than beginning with a predetermined technical solution, the collaboration started by mapping ARK’s existing workflows and validating how information moved between field teams and the organization.
The resulting prototype combines family-level data collection with a consolidated database capable of aggregating information across communities. It is also designed around field realities: digital collection can be used where connectivity permits, while paper-based workflows remain available where it does not.
Building capability alongside the solution
For Ana, the value extended beyond the technical output. ARK’s staff participated in defining workflows, testing assumptions, reviewing prototypes, and determining what would work for the communities using the system.
As Ana reflected:
“Beyond the output, our team is now more confident with technology.”
That capability remains relevant as ARK’s needs continue to evolve. The organization has since joined the Finverse Fellowship, with Ana as the Fellow, to explore a more efficient system for integrating supply-and-demand information and supporting faster, evidence-based operational decisions.
Explore more